Perio Tab
The Perio tab shows the traditional view of a perio chart where
numerical exam data can be entered and viewed for each tooth and pocket. The graphical element
of the perio chart displays anatomically correct representations of teeth and pockets in
distinct facial and palatal (lingual) views. The scroll bar on the right side of the graphical
display adjusts the window to accommodate these accurate drawings. 


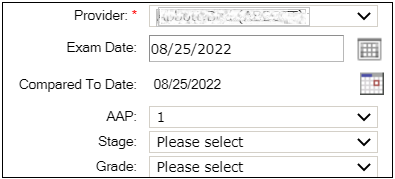
To enter the basic exam details:
- You must select a provider from the list, if not previously set.
- The selected provider’s perio preferences (Provider Setup – Chart, Perio Preferences) are applied to the module by default.
- The Compared To Date field shows the date of any previous exam results displayed as a reference in the current chart. The previous exam is either the first exam or the most recent exam as set in the provider’s perio preferences. Change to another exam by clicking the calendar icon in the field.
- You can select the ADA classification from the list.
- You can select the stage value and/or grade value from the lists. If a perio exam exists for the selected patient with the stage value and/or grade value, then by default for the new exam, the previous exam's stage value and/or grade value is filled in automatically. These values appears on the Perio Chart and Tooth Chart.
The measurement buttons control the type of entry you want to record. Click the button to record the desired measurement. For example, click the Recession button to enter data for recession.
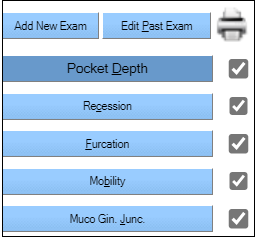
The check boxes selected next to the items under the printer icon appear on the printed chart. The provider’s preferred default settings automatically display; select or clear the check boxes as required.

These buttons perform navigational functions such as moving back or forward (Next) one pocket or to the next tooth (<< or >>). The Hide 3rds button will remove the patient’s wisdom teeth from the chart with a single click.
Double-click the  button to lock it when charting Recession for negative values. The
values are strike-through.
button to lock it when charting Recession for negative values. The
values are strike-through.
When charting Mobility, you can click the  button. A plus sign appears
on the tooth.
button. A plus sign appears
on the tooth.

The Bleeding and Suppuration buttons enable the provider to mark the previous pocket as showing bleeding, suppuration, or both. Colored dots appear at the gum line to represent the entry (Colors are set in office preferences).


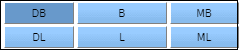
These buttons represent the tooth pockets. As the perio auto-advance proceeds through the path, the appropriate button darkens. A provider can use these buttons to navigate within the chart outside the flow.

You can add specific types of services to the perio chart (setup is required) using these buttons. The entries flow to the tooth chart and are represented in the tooth chart.
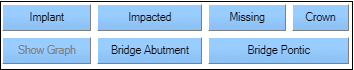
The Show Graph button adds the graphed results of the exam findings to the Perio tab. You may view the graphed results at any time, click the Show Graph button each time to refresh the results. The graphed results remain until the provider leaves the module.

The order the exam proceeds through the teeth is based on the provider preference established in the Provider Setup window. However, you may use another tooth order and exam flow for the exam. Type the desired order in the Teeth Order field and select the exam flow from the Exam Flow list.
