Perio Graph Tab
Many providers and patients find more meaning in a graphical representation of the periodontal exam findings. You can display the graph by clicking the Perio Graph tab. This tab displays only the graphed results of the periodontal exam with options for zooming in for a closer view of a particular quadrant.
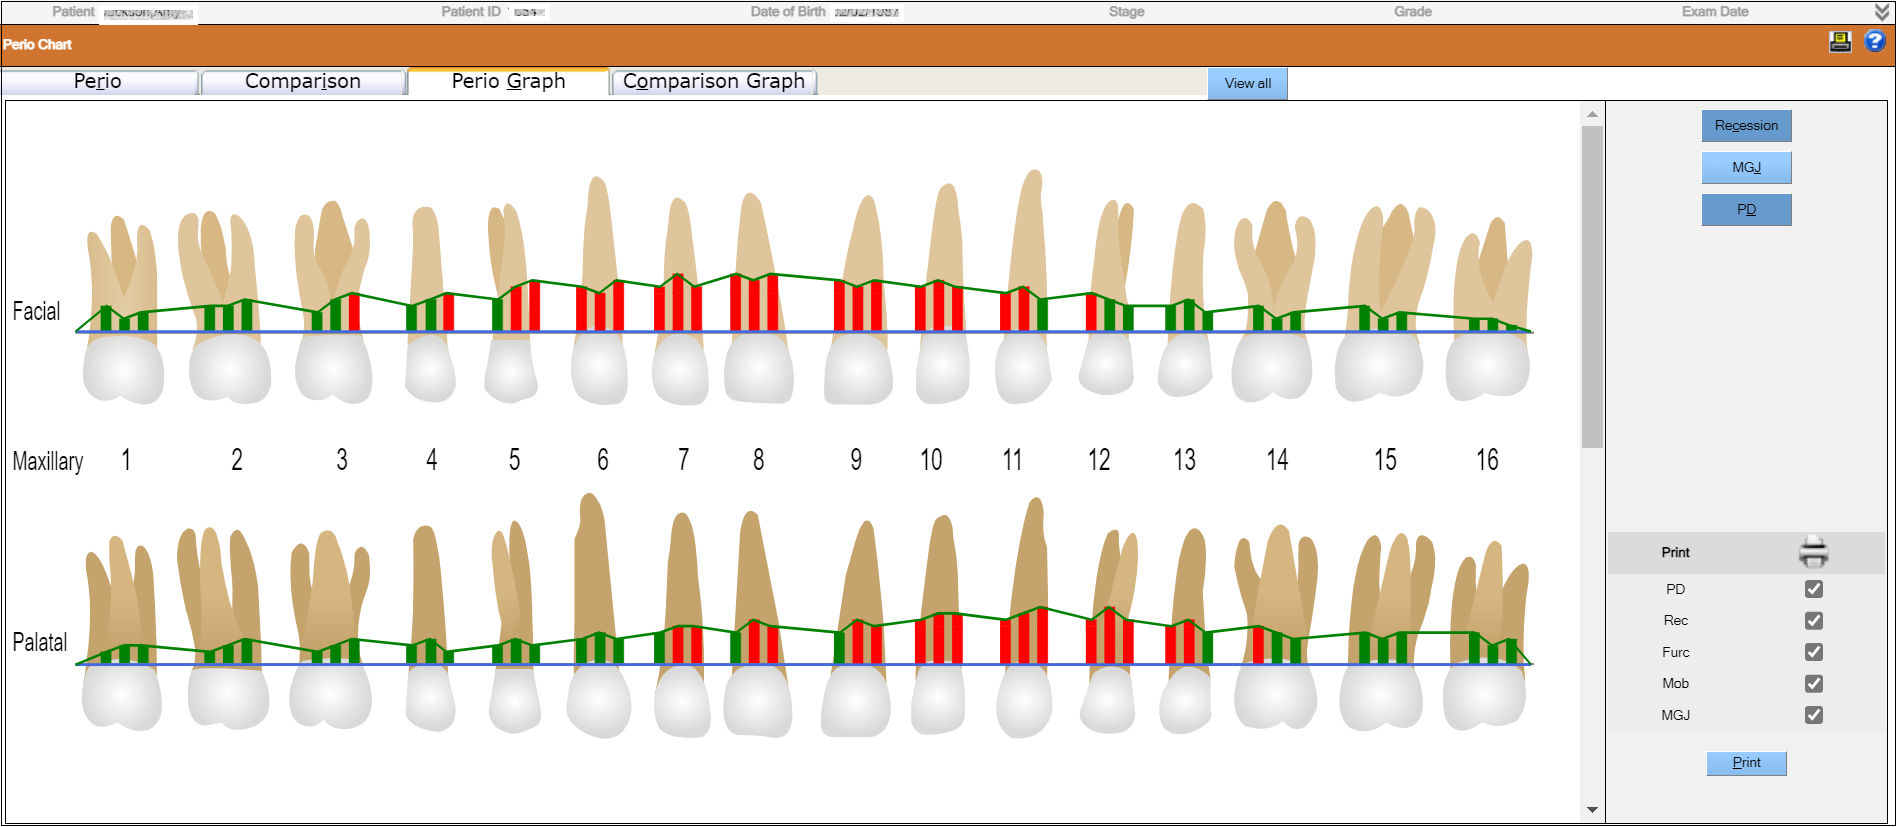
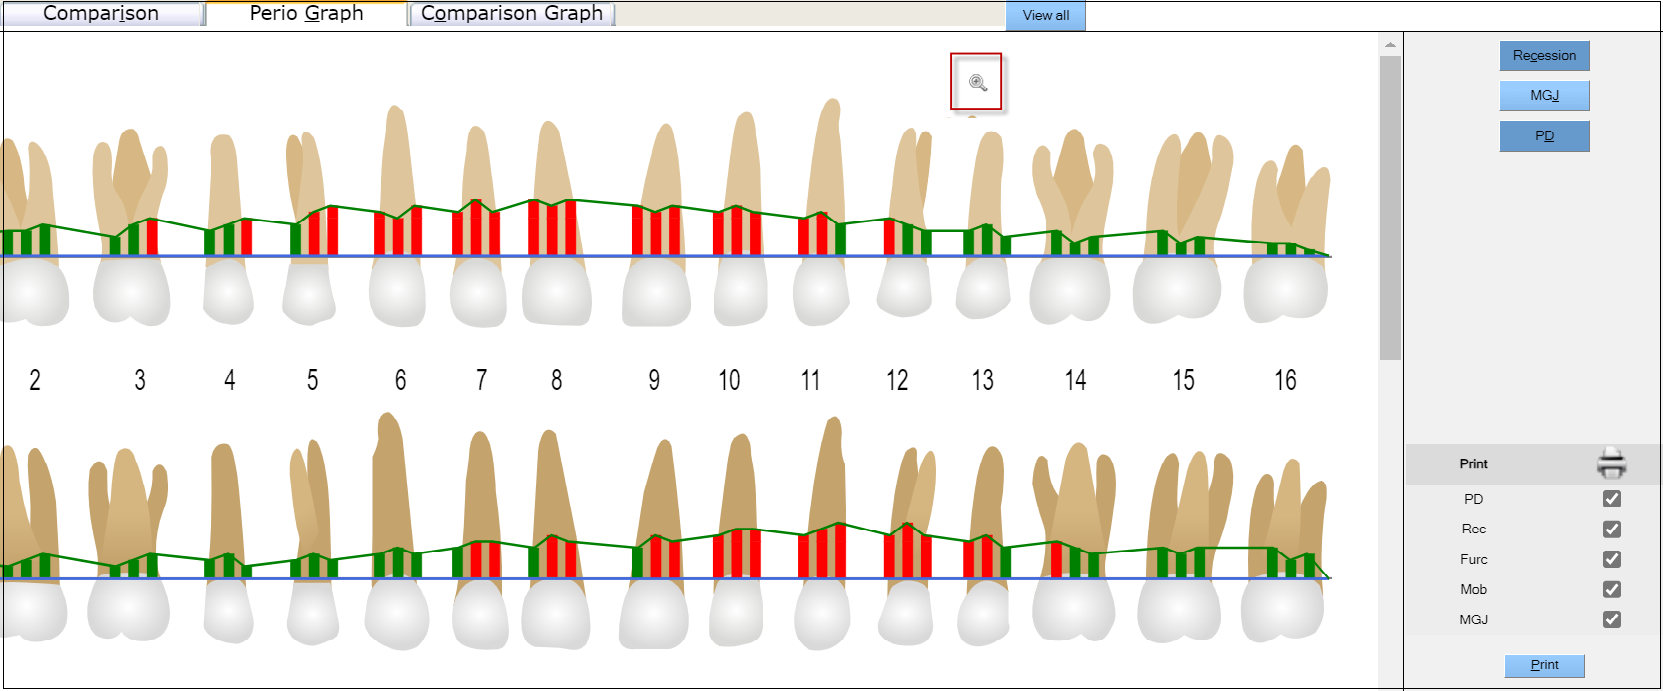
The colors in the graphic chart provide additional information for the provider relative the established alert level. Measurements that exceed the alert level will be emphasized using red, while the green indicates measurements below the alert level. For example, the provider has set his alert for a pocket depth of four. The graph lines appear green for pocket depth measurements of three or less, while measurements of four or greater are shown in red.
To display the recession and muco gingival junction measurements, click the buttons on the right side of the window as desired. Click Print to print a paper copy of the exam results.
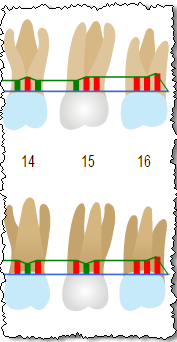
The Perio Graph tab also enables a user to zoom into a particular quadrant for a larger view. Click the mouse anywhere in a specific quadrant to zoom in. Clicking the mouse again returns the normal view.