Periodontal Charting Introduction
Periodontal health is an important component of a patient's overall oral health. Diseases like gingivitis can seriously impact the quality of the teeth, gums, and mouth. QSIDental Web has a comprehensive periodontal module to help chart and track the patient's periodontal health. This module supports full charting of pocket depth, gingival margin, and other indicators in both numerical and graph formats.
Additionally, this module helps track the improvement or deterioration in the patient's condition by comparing the periodontal examination results over time. These comparisons enable a practice to provide consistent service and build a strong relationship with the patient.
- Clicking the Perio icon
 on the toolbar.
or
- Selecting Perio from the Clinical menu.
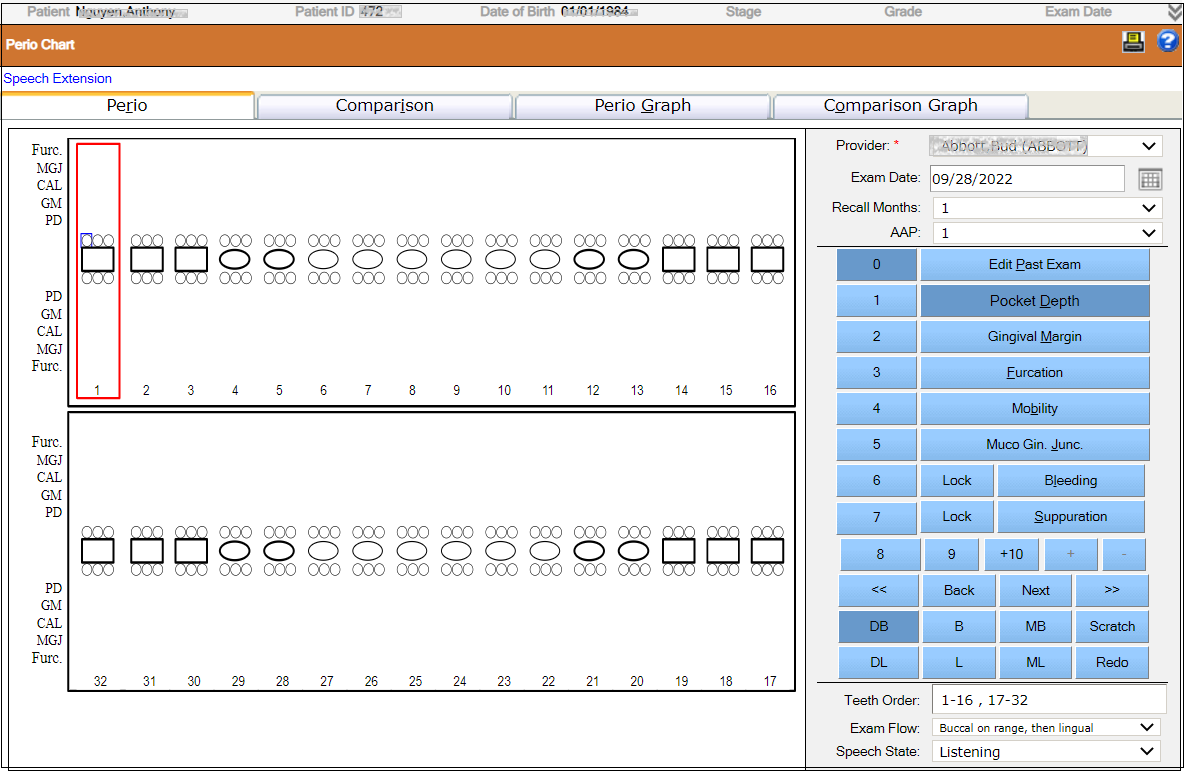
The Periodontal Chart module is divided into four tabs. The four tabs break the periodontal charting tools into easily identifiable functions. The four tabs are:
- Perio - Traditional view of a perio chart where numerical exam data can be entered and viewed
- Comparison - Comparison of the results of past exams in numerical form
- Perio Graph - Visual representation of an exam in graph form
- Comparison Graph - Graphical comparison of the results of up to three past exams