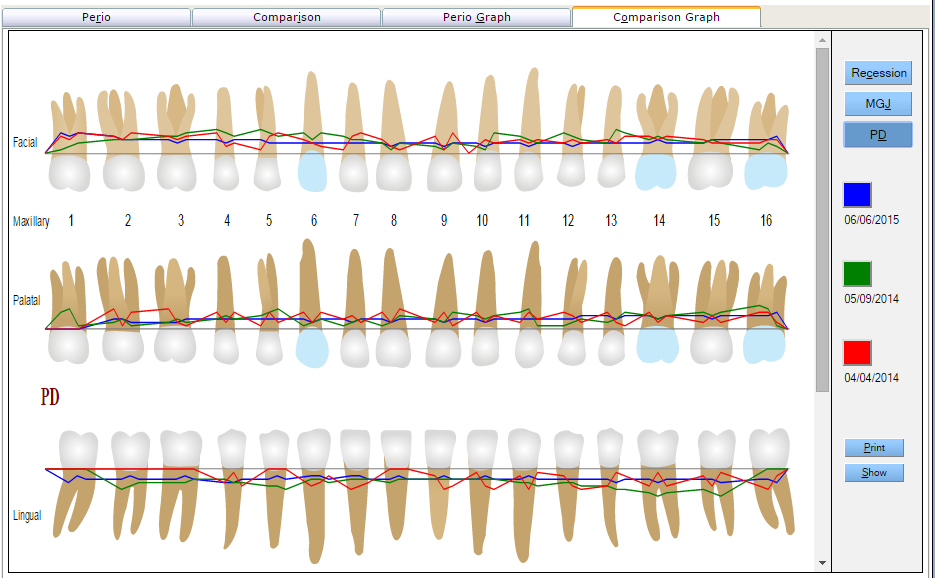
This tab compares up to three saved periodontal charts in graphical format. This graphical
comparison may be filtered for more specific indicators such as recession and muco gingival
junction. Each exam graph is represented by a specific color, indicated on the right side of
the screen.
The display can be filtered for different measurements by clicking buttons on the right side
of the screen. Only one finding can be displayed at a time.
Recession
= Show recession measurements
MGJ
= Show mucogingival junction grades
PD
= Show pocket depth
A quadrant can be studied more closely by zooming in and clicking the mouse in the area to
enlarge. The normal view can be restored by clicking the area again.