![]()
![]()
![]()
|
|
|
|
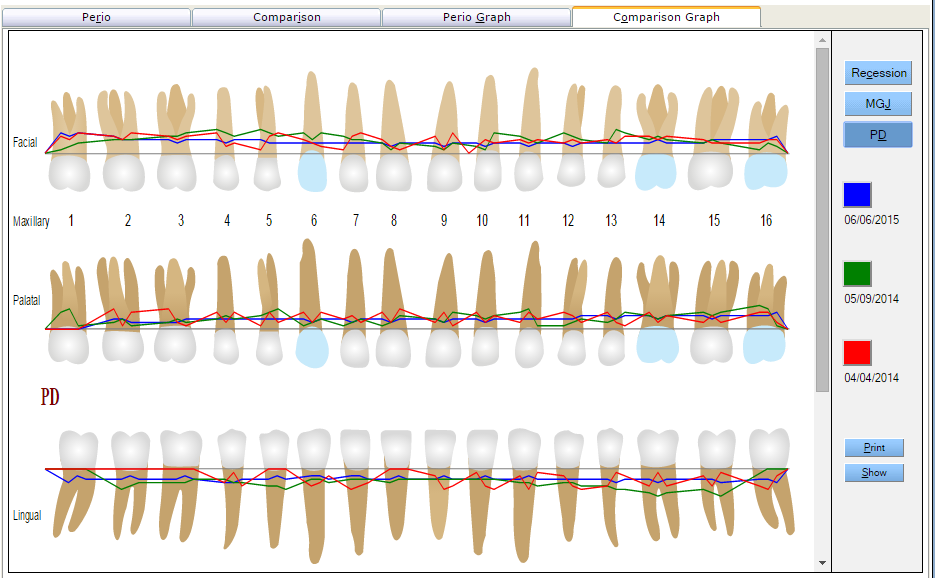
In the Comparison and Comparison Graph tabs, the provider can select and compare measurements from up to four saved periodontal charts. Comparing charts allows a provider to evaluate any changes in the patient’s periodontal condition. As many as four specifically selected exams may be used for the comparison.
The Comparison tab shows the selected measurements using color coded numbers.

The Comparison Graph tab shows the selected measurements using color-coded line graphs.