![]()
![]()
![]()
|
|
|
|
Many providers and patients find more meaning in a graphical representation of the periodontal exam findings. To see the graph view, click the Perio Graph tab. This tab displays the results of the periodontal charting window in bar graph form.
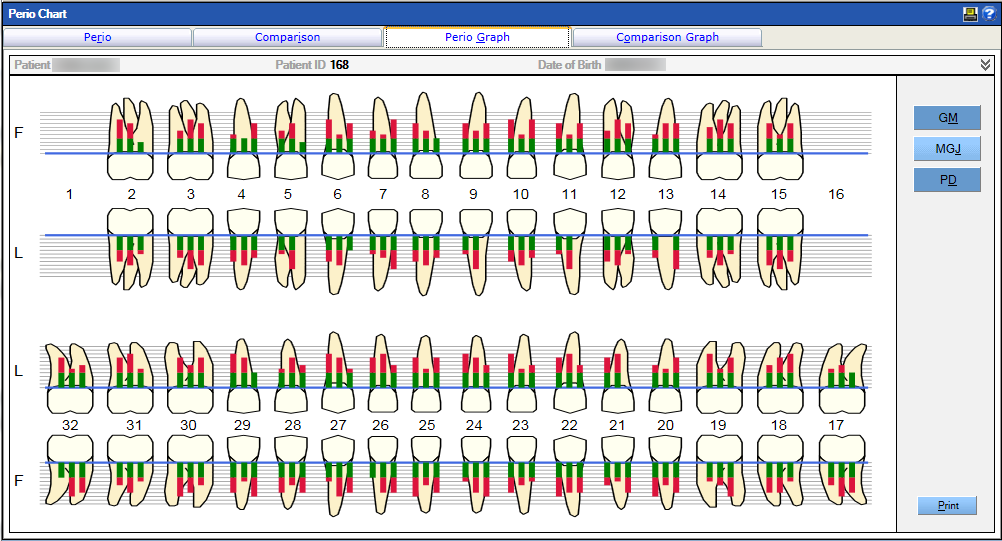
The colors in the graphic chart provide additional information for the provider relative the established alert level. Measurements that exceed the alert level will be emphasized using black, while the green indicates measurements below the alert level. For example, the provider has set his alert for a pocket depth of six. The graph lines appear green for pocket depth measurements of five or less, while measurements of six or greater are shown with in black.
To display the Gingival Margin or Muco Gingival Junction measurements, click the buttons on the right side of the window as desired. Click the Print button to print a paper copy of the exam results.