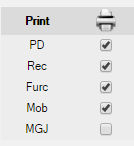
On the Perio tab, the printing tools are located on the right side of the window with the data entry tools. The printing preferences overlap with the measurement selection tools. On the Perio Graph tab, the checkboxes are summarized on the lower right section of the window.
The checkboxes beside the measurement types and under the printer show which items will show on the printed chart. Select or deselect the checkboxes as desired to create the best report for this patient.


The report available for the Comparison tab closely mimics the tab itself. It shows the numerical values of the selected exams and the summary.
The report available for the Comparison Graph tab closely mimics the tab itself. It shows the graphed values of the selected exams in the colors chosen for the tab.